Short summary
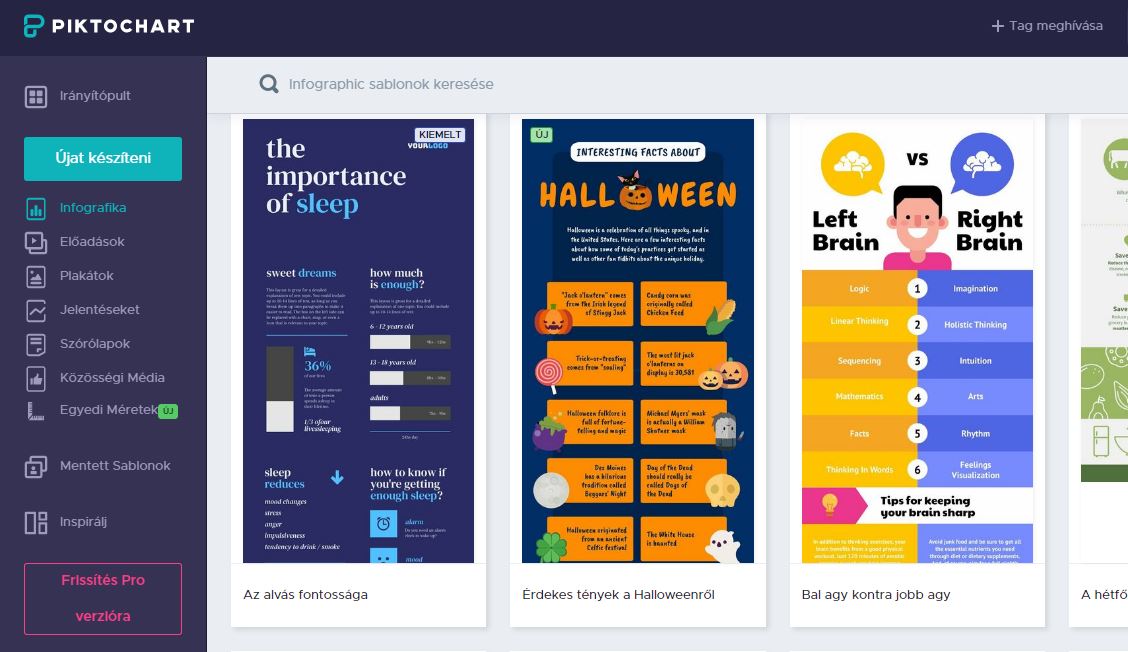
Application for creating infographics.
Description

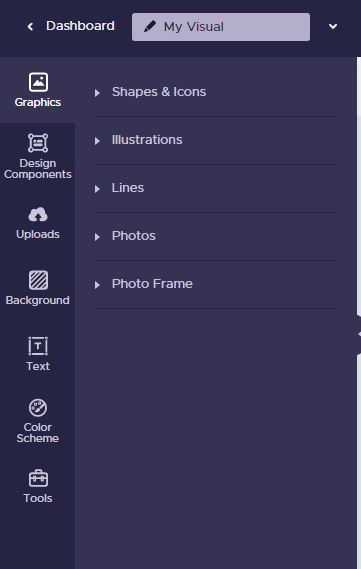
After registration, we can use the program to create appealing illustrations. We can choose from a variety of templates or alternatively, start work on a blank page. The site is user-friendly, making it easy to create posters, infographics and presentations. You can drag and drop text, images, illustrations and icons onto your worksheet.

You can save the final result in various formats (PNG, PDF).

Piktochart dashboard


Piktochart nyitóképernyő

There is the possibility for learning within the site, using the Tour.   Túra.

Advantages
  • easy to use
  • there are a lot of templates, examples that give inspiration
Disadvantages
  • there are templates and features that are only available in the premium version
Usage in teaching/learning
  • simple tool to create online infographics
  • 3 members can be invited to collaborate even in the free version
Type of tool

Infographics

Infographics

"A picture is worth a thousand words."

In our increasingly visual world we often prefer to look at a well-designed, informative poster with some text than read a long leaflet on the same subject. This is particularly true for our students, so it makes sense to present them the information in a form they can easily digest. An excellent tool for this is an infographic, which presents the information using images.

You can also use it to check understanding: ask students to present in an infographic what they have learned. It is also useful for organizing learning content from different parts of the curriculum. Units of measurement or historical events are a good example for this.

Pricing
Free version available
Interface language
English
Does it have a built-in repository where we can browse content created by other teachers?
yes
Does the free version support online cooperation?
yes
Difficulty
For beginners
Author
Hegedüs Helén

More digital tools

Prezi logo