More digital tools

A free, professional vector graphics program, suitable for use in schools, for small-scale graphic design projects or for creating web graphics.
Both in its functionality and tools, it is very similar to CorelDRAW or Adobe Illustrator.
- free
- flexible drawing object management: the outline, filling, size, or the form of any flat shape can be changed in seconds, no erasing needed, everything can be modified
- Bézier curves (paths)
- shading options: colour transitions, opacity, blurring
- text to path function
- layer management
- wide range of input and output formats
- PDF reading and saving
- PNG export
the interface is quite complex, so novice users may find it difficult to use
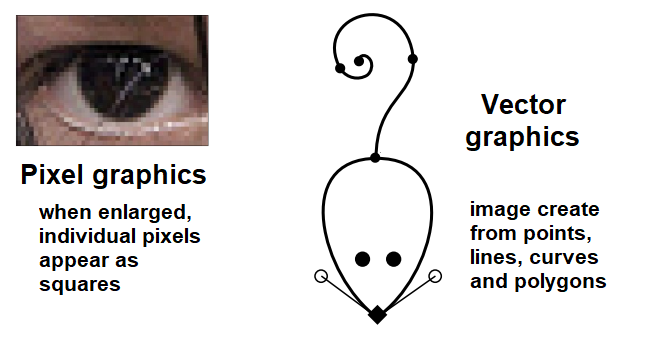
In pixel graphics, patterns and shapes are made up of many small dots on a square grid (using a very large sheet and many dots, you can draw photo-like images with this method, but the image will be distorted and pixelated when enlarged).
Vector graphics uses a mathematical trick to build the image much more simply, using lines and dots. These can be enlarged, rearranged, shaped and coloured the way you prefer, they are not pixelated or distorted.
Inkscape stores drawings in SVG, or Scalable Vector Graphics, but reads a wide variety of formats. SVG (Scalable Vector Graphics) is a standardized file format supported by the International Web Consortium that can store text and bitmaps in addition to mathematically described vector graphics.
This program enables the creation of:
- logos, pictograms, icons
- graphics and illustrations
- business cards, letter paper, brochures, flyers, posters
- figuratervet rajzfilmhez, meseillusztrációhoz
- comics, storyboards
- calendars, timetables
- T-shirts, badges
This images shown here are uploaded in PNG format due to platform limitations and were sourced from SVG.