


Method walkthrough
It is used to establish the causal relationships of problems.
You always have to start from the cause, looking for real causes, not the lack of something. Kaoru Ishikawa was first developed and applied by a Japanese quality expert in 1943 to establish the causal links between the problems. The problem is shown as an end result on the right side of the diagram (fish head), the major influencing factors are on the left side of the diagram in a form similar to the fish skeleton. Hence the name herringbone.
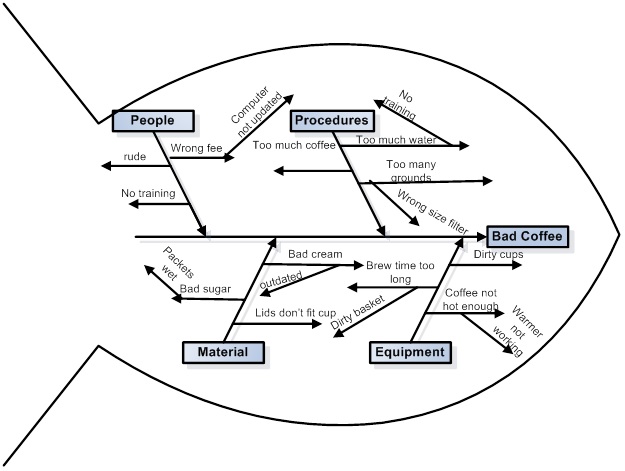
forrás: https://hu.wikipedia.org/wiki/Isikava-diagram#/media/F%C3%A1jl:Fishbone_BadCoffeeExample.jpg
The reasons are on the left and the cause is on the right. We record a cause on one strand, the main group of causes on the large strand.
Benefits
Problems can be revealed through a causal examination.
Challenges and pitfalls
"However, we do not get an answer with the method to what extent the causes contribute to the development of the problem. Another quality control tool, Pareto Analysis, can be used to do this. "
Source: https://studiumalfa.ewk.hu/elemzo-technologiak/
Practical tips
forrás: https://hu.wikipedia.org/wiki/Isikava-diagram#/media/F%C3%A1jl:Fishbone_BadCoffeeExample.jpg