There is a great variety of icons and high quality images to choose from. Unfortunately, the free version has limited options (no more than 5 designs are allowed), but there is also a special subscription for educators.
If you use the tool regularly, you can organise your work into folders, and in the premium versions you can edit your work in collaboration with colleagues and students.
It is also possible to set up your own style. You can choose colours, upload a logo - so you can give your work a branded, coherent look.
There is a separate pricing plan for educators with a 14-day trial. This package is allows for 35 students to join.
Using the free version we can
- create only up to 5 designs, and
- upload no more than 6 images/charts of our own.
It can be used to create timelines, mind maps, flow charts, diagrams, but it is also suitable for summaries, reports and presentations
It is worth familiarising students with this tool as the use of infographics is very common in business life. Infographics are used for marketing materials, online magazines, social media posts, as wll as to create annual reports, presentations.

- Anmelden oder Registrieren, um Kommentare verfassen zu können
Mind map
What is a mind map?
A mind map is a visual tool for structuring thoughts. It is a hierarchical diagram of everything that has been discussed. Key ideas/text/symbols/colours helps trigger mind flow and more detailed explanation to the presenter.

What is it good for?
As a study aid — the visual element is great at triggering memories.
Researching new products and developing new ideas — as you discuss topics, they are recorded, allowing you to track idea development more easily, and for visualization for multiple people.
As a problem-solving tool — helpful in brainstorming problems and building on ideas to determine solutions.
As a presentation method — one is able to show how a process was developed, visualizing alternatives and topics discussed.
- Start with a focus - This idea or thought needs to be the center of your mind map.
- Plot sub-groups - From your main idea, you will determine key areas, which are sub-groups of your focus.
- Develop further - Each of your sub-groups will likely to have their own set of sub-groups (use of a single keyword).
- Expand – Add additional facts, pictures, symbols etc.
- Add connections between (sub)groups to present interrelations.
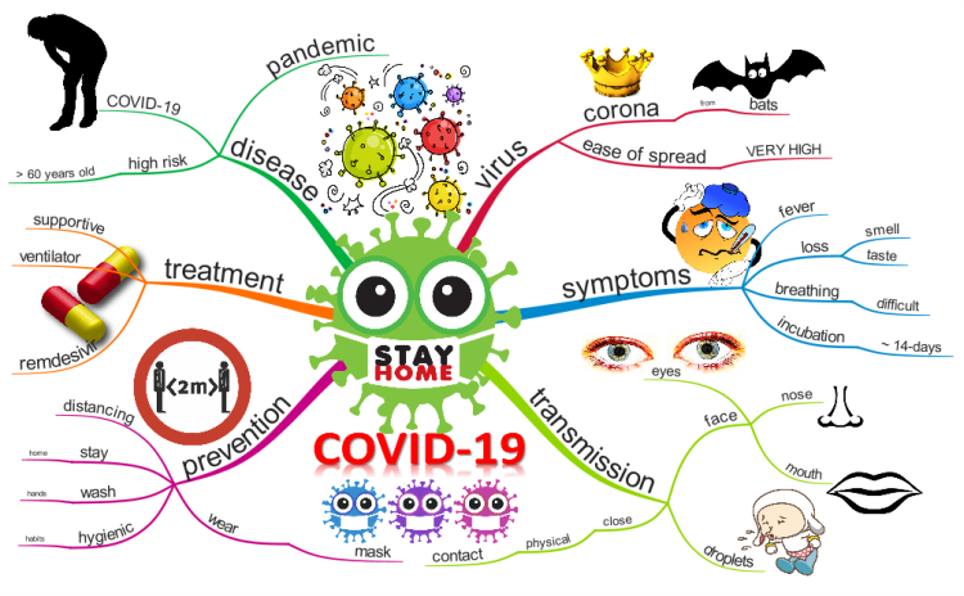
An example

source: https://www.biggerplate.com/mindmaps/KqfPO5IW/covid-19
Did you know?
1970 - British psychologist Tony Buzan popularized the term mind map.
Timeline
Timeline
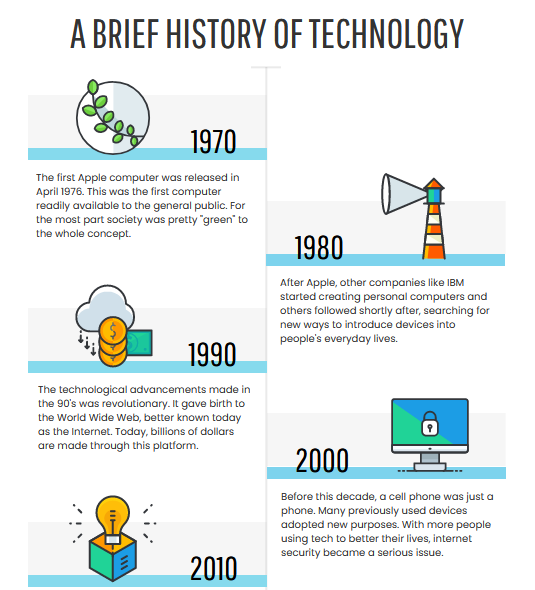
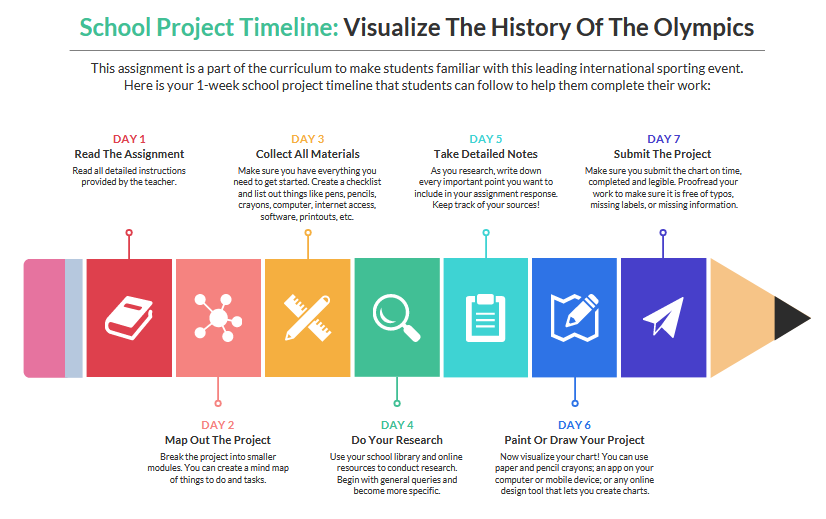
A timeline can be used for any topic where the order of events, the chronological order matters. We can use it when teaching history, but also when presenting a process or a succession of events.
For example, you can display historical events of a particular period with dates and inert notes to them with the most important facts.
It is not only for teachers - students can also create a timeline collaboratively when they recap on a topic.
In timeline creator apps you can use a variety of templates to make your own stunning and meaningful infographics in no time.

Infographics
Infographics
"A picture is worth a thousand words."
In our increasingly visual world we often prefer to look at a well-designed, informative poster with some text than read a long leaflet on the same subject. This is particularly true for our students, so it makes sense to present them the information in a form they can easily digest. An excellent tool for this is an infographic, which presents the information using images.
You can also use it to check understanding: ask students to present in an infographic what they have learned. It is also useful for organizing learning content from different parts of the curriculum. Units of measurement or historical events are a good example for this.
Presentation
Presentation
Using one of the tools below instead of the usual - and let's face it, often boring - PowerPoint presentation will surely result in success.
Being short of time, you can turn a previously prepared ppt into a video in just a few steps. Choose Save As, then save the presentation as .mp4 and you're done.
